the excess of metaperiodate can be analyzed by UV spectrophotometry at 222 nm (63), but the method is neither specific nor sensitive especially when analyzing complex matrices as in our case.
A micromethod for sugars susceptible to oxidation by NaIO4 was proposed by S. Avigad (5). Tripyridyl -s- triazine (Figure 27) forms a complex with ferrous ion (TPTZ)2Fe2+ with intense blue-violet color

Figure 27. 2,4,6-Tripyridyl-s-triazine
In the original method two determinations were made: One with the sample and the other with water and TPTZ (control). The periodate consumed was calculated by difference. In the modification proposed in this work a fixed volume of reactive is titrated in the spectrophotometric cuvette with the sample previously diluted and the periodate concentration is obtained by a sample addition method (details in Material and Methods). With this method, an estimation of error can be made, and possible deviations in volume addition, instrumental response etc are minimized.
Another factor to be taken into account is the low solubility of PIA in pure water. Structural determinations of PIA required large volumes of bacterial culture (900 mL to several liters according the authors) (46, 62) which is not suitable for analytical purposes. In this work we use as extractant a solution of N,N-dimethylacetamide with 5% lithium chloride (68,69). This solution is one of the few capable of solubilize chitin (of similar structure of PIA but with ß(1-4) links of N-acetylglucosamine). With this solvent and the extraction method proposed significant differences in periodate consumed can be measured from initial samples of 50 mL.
Chromatographic calibration.
A separation with a Sephacryl S-300 (5,8 cm x 1.5 i.d.) was made. The column was previoully calibrated with dextran standards of MW 11600 and 48600 respectively.
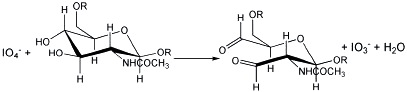
Dextran polymers contains a1-6 glucose linked units branched with a1-3 in about 5% having vicinal hydroxyls susceptible to oxidation by NaIO4. The fractions collected were oxidized for 12 h, and the periodate consumed was obtained by difference with a control. Since the long oxidation periods and the relatively high temperatures one could expect an overoxidation of the hydroxyl groups passing from aldehyde to carboxylic acid. This effect should be avoided in structural determinations, but in our case we can take advantage of it, because the greater periodate consumption results in a more sensitive determination. An additional benefit is obtained from the overoxidation. Since the oxidation was made in an unbuffered solution and deionized water was used in the chromatographic elution, the acidic groups formed should lower the pH in the fractions containing the polysaccharide. This is what is observed in practice; so that a simple pH inspection in each fraction informs us about of the position of the polysaccharide in the series.
We can see in Figure 28 that the minimum in periodate concentration (maximum polysaccharide concentration, fraction 7,) coincides with the minimum of pH value
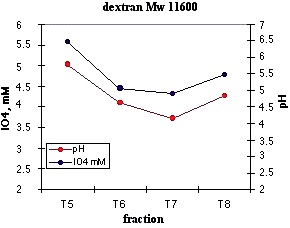
Figure 28. Calibration with a standard dextran.Variation of pH and periodate concentration after the oxidation of the chromatographic fractions.
A similar correlation was observed with dextran standard Mw 48600 (Figure 29). The minimum appeared in fraction 4, about 7mL.
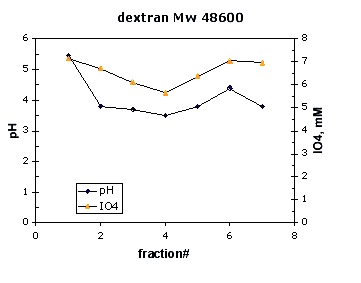
Figure 29. Calibration with dextran, Mw 48600.
The difference between the periodate consumed by each fraction and the control allowed us to draw a chromatographic profile
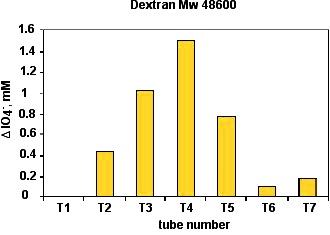
Figure 30. Calibration with dextran Mw 48600 (480 mg/L). Injection, 2mL
Extracts analysis
An extract of S. Epidermidis RP62 (PIA producer) with added glucose at 8 h (25) was analyzed. (see Material and Methods for the extraction procedure). The process of chromatographic separation and quantification was the same as for the dextran standards. The titration of the fractions collected yielded very precise results. Linear regression values for the fractions 4 & 7 , and the final [IO4 -] are shown in Table 6 and plotted in Figure 31
Table 6. Titration data of the fractions 4 and 7
|
fraction |
n |
r |
Veq ± tsa, µL |
|
|
T4 |
6 |
0.99996 |
393 ± 3 |
7.34± 0.08 |
|
T7 |
8 |
0.99997 |
430 ± 2 |
6.71± 0.05 |
a Student t , p = 0.05. s from [5] in Material and Methods
b s from Sm (see Material and Methods)
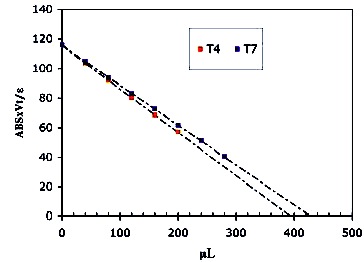
Figure 31. Titration curves of the fractions 4 and 7.The equivalence volume is obtained from the intercept to the volume axis
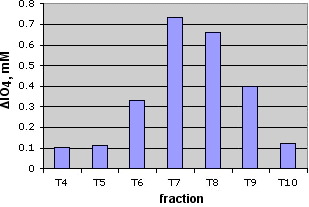
Figure 32. Chromatographic profile of the culture extract (see Material and methods)
The excellent linearity of the curves and the small errors allows us to establish significant differences between the fractions and make comparative studies with different samples as it is derscribed in the following paragraph.
Effect of allicin
Once established the analytical method,the next step was the study of PIA production in bacterial extracts of cultures containing subinhibitory dosis of allicin and compare the values of periodate consumed with that of control cultures without allicin. In the first experiment we prepared two 50 mL cultures of S epidermidis. One with allicin at 4 µg/mL , and the other without allicin. (see Material and Methods). In all assais PIA extraction was done from the biofilm adhered to the walls of the container and the bacteria precipitated after centrifugation. The extracts were passed trhrough a Sephacryl S-300 column proceeding as described before. The results are shown in Figure 32. The maximum of control appears in fraction 6. In allicin treated samples the maximum appears in fraction 7. This could be due to an interfering species or to a PIA with different molecular weight. In all cases, the periodate consumed by allicin added extracts is less than of the control samples. This is especially significant in the fraction 6 .
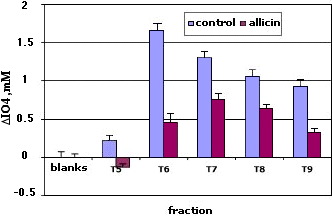
Figure 33. Periodate consumed by the fractions 5-9 after chromatographic separation of the extracts with allicin (4 µg/mL). and a control without allicin: Extractant, 1mL NNDMA
A second procedure for PIA extraction was carried out. The bacteria were grown in test tubes, (five tubes with allicin and another five without allicin) . The tubes were centrifuged an washed.The first tube was extracted with 2 mL of NNDMA/LiCl using glass microbeads and sitirred with a vortex. The extracts were passed to a second tube and vortexed again. The process was repeated with the other tubes and the final extract was centrifuged and passed trhrough a 0.45µ filter. This solution was passed by a Sephadex “desalting” column and then was chromatographed with a Sephadex S-300 (18x 1cm) . In Figure 34 appear the values of periodate consumed by the fractions.
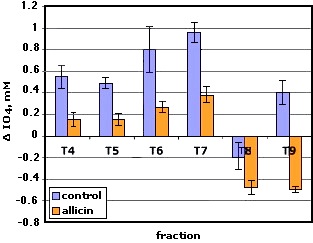
Figure 34. Quantification of the chromatographic fractions T4-T9. Bacteria were grown in test tubes. Extraction with 2mL NNDMA
As it can be seen on the chart, all fractions from cultures treated with allicin give values of periodate consumed notably lower than of the control. Negative values of fractions 8 and 9 can be due to the presence of the extractant NNDMA because a strong absorbance at 240 nm was observed in these fractions. In the original article (5), the author referred to N,N-dimethyl formamide as an interference in the determination of sugars. Previous studies of oxidation with N-acetyl glucosamine in the presence of NNDMA showed a diminution of 28% in mole of periodate consumed compared with a control of NAG in water. The presence of this extractant may represent a serious interference in the analysis of lower molecular weight polymers (i e <10000) and should be avoided by using the minimum volume in the extraction process (ie 1 mL) or using chromatographic columns of better resolution.
Discussion
The assays previously described show that periodate consumption in samples with allicin is lower than that of the control samples without allicin, although some periodate in these samples is consumed too, perhaps due to the presence of an interfering species, an incomplete inhibition or both. We have also to consider that at the low concentration of allicin (4µg/mL) employed a fraction of bacteria might not be affected by allicin at the PIA production period (postexponential phase). Finally, the progressive decomposition of allicin at 37ºC during this period should be taken in account.
We can summarize the aforementioned results in the following points
º PIA is the main agglutinating factor in the biofilm (for the strain studied ,RP 62) and in the cultures with allicin the biofilm production lowers in a considerable extentThe studies on PIA production made by Tübingen’s research group (29) have shown that the polysaccharide requires a glycosyltranferase expressed by the so called icaA operon , but the greater production was obtained when Ica A was expressed in conjunction with with another gen IcaD.
º The analysis with periodate (a PIA oxidizer) yield lower values in allicin treated samples.
º The results of the “distance effect” point out that small amounts of an active agent (allicine or some allicin derivative ) produces a considerable -and long lasting- inhibition on biofilm formation, which suggest an action on the outer side of the bacteria. And that’s for two reasons. First, the enzimes embedded in the membrane-transmembrane- would be more accesible to allicin than those in the inner part of the cell . On the other hand enzymes in the cytoplasm are more protected by reducing molecules as NADH or glutation than those on the outer membrane. This could explain the persistent effect of biofilm inhibition we observe in growing bacteria (see figure 20)
º Finally, the hypothesis of an enzimatic inhinbition by blocking sulfhydril active centres is reinforced with the assays with iodoacetic acid and the biofilm inhibition with N-acetylcysteine (54)
In order to know the structure of the enzymes, we made a survey on data bank Expassy-SwissProt. The results for Ica A in two strains are showed below
strain 1282
strain RP 62
For the strain 1282 the aminoacid sequence is
MHVFNFLLFY10 PIFMSIYWIV20 GSIYYFFIKE30 KPFNRSLLVK40 SEHQQVEGIS 50FLLACYNESE60 TVQDTLSSVL70 SLEYPEKEII80 IINDGSSDNT90 AEIIYDFKKN100 HDFKFVDLEV110 NRGKANALNE120GIKQASYEYV 130MCLDADTVID140 DDAPFYMIED150 FKKNPKLGAV160> TGNPRIRNKS170 SILGKIQTIE180 YASIIGCIKR 190SQSLAGAINT200 ISGVFTLFKK210 SALKDVGYWD220 TDMITEDIAV230 SWKLHLFDYE240 IKYEPRALCW250 MLVPETIGGL260> WKQRVRWAQG270 GHEVLLRDFW280 PTIKTKKLSL290 YILMFEQIAS300 ITWVYIVCY310 LSFLVITANI320 LDYTYLKYSF330 SIFFFSSFTM340 TFINIIQFTV350 ALFIDSRYEK360 KNIVGLIFLS370 WYPTLYWVIN380 AAVVIMAFPK390 ALKRKKGGYA400 TWSSPDRGNI410 QR
The units of cysteine have been coloured in yellow. There are five which implies at least a free cysteine (with the other four forming two disulfide bridges) The second strain RP 62 A (ATCC35984), used in this work is almost identical except I 308 is replaced by L. The cysteine number and positions are kept
For Ica D in the strain RP 62 A (36)
The protein have this aminoacids sequence…
MVKPRQRQYP10 TVTSYLNIVR20 ESLFITISGV 30FWMYCIVVMI40 VYIGTLINSQ50
MESVITIRIA60
LNVENTEIYK70 LFGWMSLFVL80 IIFIFFTFSL90 AFQKYKKGRD100 I
If one of these free cysteine were part of an active centre, or formed a further S-S bond in these enzymes, this centre might be blocked by allicin so that PIA formation gets discontinued
Since the allicin inespecific mode of action and to an insufficient experimentation we can not unambiguously attribute the biofilm inhibition to an inactivation of the aforementioned enzymes. Nevertheless, the experimental results suggest that future research should follow this direction.
Finally, the confirmation of this hypothesis at biochemical –molecular- level would provide a scientific evidence that made easier the future clinical application of allicin as a biofilm inhibitor.