
Figure 16 Biofilm formation in the presence of allicin (4µg/mL) (left tube), and a control without allicin (right)
Inhibition of biofilm by allicin
During the growth inhibition tests with Staphylococcus
epidermidis an additional effect on biofilm formation was observed:
The biomaterial (slime) adhered on to the walls of the test tubes with
sub MIC allicin initial dosis was considerably reduced. Figure 16 shows
a clear difference in biofilm production in allicin treated sample
compared to that control
Figure 16 Biofilm formation in the presence of allicin (4µg/mL)
(left tube), and a control without allicin (right)
A quantitative analysis of biofilm production was made to measure
the extent of this inhibition effect. The produced Biofilm was stained
with crystal violet in microtiter plates according to the method of
Christensen (see Material and Methods).
The results of the assay with allicin at subinhibitory dosis are showed
in Table 4. The biofilm production after growing with 1/2 MIC was
significantly lower than that of control. For higher dilutions the
biofilm production raised; but even at 1/16 dilution, the slime index
was smaller than the control value. Only at 1/32 dilution the values
were similar to the control levels in most of strains.
Table 4. Slime index(S.I.) for serial
dilutions of allicin
|
Strain |
Control |
1/2 MIC |
1/4 MIC |
1/8 MIC |
1/16 MIC |
1/32 MIC |
|
ATCC35984 |
2.8±0.5 |
0.1±0.12** |
0.2±0.2** |
1.50±1.0 |
2.8±0.7 |
3.0±0.5 |
|
2893 |
2.5±0.3 |
0.10±0.05* |
0.2±0.1* |
0.6±0.8 |
1.9±0.6 |
2.2±0.1 |
|
9542 |
1.4±0.5 |
0.1±0.1** |
0.2±0.1 |
0.3±0.3* |
0.5±0.5* |
0.8±0.5 |
|
12 |
1.9±0.5 |
0.08±0.05** |
0.2±0.2* |
0.14±0.1* |
0.2±0.2** |
0.5±0.2 |
|
2526 |
2.9±0.6 |
0.2±0.15* |
0.55±0.4 |
0.7±0.4 |
2±1.0 |
3.4±0.4 |
Slime index is the ratio between the optical
density of the biofilm stained and before staining (ODb/ODc) ± sd
*p < 0,05 ; ** p < 0,01; allicin CMI rank = 4-8 µg/mL
The values from Table 4 are plotted in Figure 17
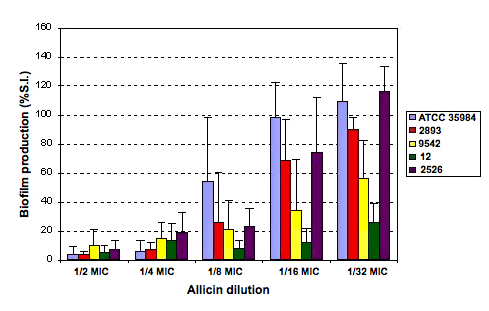
Figure 17. Percent variation of the slime index with
respect to the controls (100%) of the five strains studied
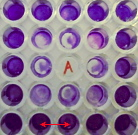
Figure 18. Biofilm inhibition in the wells surrounding an allicin
solution (labelled with A) The biofilm reduction in the wells next to
the allicin one is clearly visible.
A more systematic study was made by measuring the distance from the
central well with allicin to the surrounding wells. The final slime
values for equidistant wells were averaged.
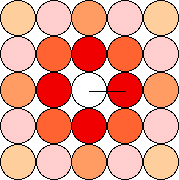
Figure 19. Disposition of the wells surrounding the central well
with allicin. The distance between the centers of the neighboring wells
is 9 mm; from this value the distances to the other centers are
calculated easily.
In Table 5 the biofilm values (S.I.) appear referred to the distance to
the well with allicin
Table 5. Averaged values (n=5) of optical density and
slime index for the wells equidistant to a central well with allicin
| color |
Distancea (mm) |
Growth(OD 490nm) |
Biofilm (OD 490nm) |
S.I.b |
| • |
9 |
0.47 ± 0.05 |
0.08 ± 0.02 |
0.17 ± 0.05 |
| • |
12.7 |
0.46 ± 0.05 |
0.51 ± 0.4 |
1.11 ± 0.4 |
| • |
18 |
0.42 ± 0.04 |
1.34 ± 0.4 |
3.19 ± 0.4 |
| • |
20.1 |
0.41 ± 0.03 |
1.45 ± 0.2 |
3.53 ± 0.2 |
| • |
25.4 |
0.45 ± 0.03 |
1.6 ± 0.1 |
3.55 ± 0.1 |
a Distance from the well containing allicin.
b S.I. : slime index (ODb /DOc) ± sd.
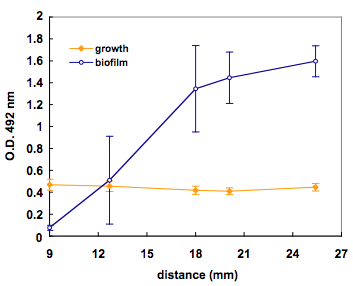
Figure 20. Variation of biofilm with distance from a central
well with allicin
In order to confirm these results, similar experiments were made with
a solution of papain in place of bacterial cultures. Papain is a
proteolytic enzyme with a sulphydryl active centre that can be
inactivated by allicin (see Introduction). The use of an enzyme presents
experimental advantages over bacterial cultures; its concentration can
be measured from its activity -known by commercial references-, or by
Ellman´s reagent (See Material and Methods); besides, the final
results are easier to interpret. So a possible inhibition of the enzyme
should be reflected in a loss of activity when a suitable substrate is
added after the exposition to allicin vapors. The substrate used is the
Na-Benzoyl-L-arginine 4-nitroanilide (BAPNA). Papain hydrolyzes this
molecule according to:
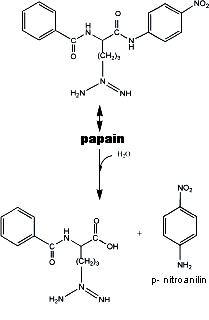
The p-nitroanilin released can be measured spectrophotometrically at
405 nm.
The assay consisted of a column of seven wells with allicin in the
central well and the enzyme solution in the other six wells (see Figure
22). A control series with the enzyme solution was put as far as
possible from allicin well and was sealed with tape to preserve it form
external vapors. The plate was covered with another microtiter plate and
let for 1h at room temperature. After this interval, the well containing
allicin was aspirated off. Then the substrate was added to the enzyme
solutions and the plate was put in a reader plate. The absorbance was
read every 2 min to a total of 20 reading.
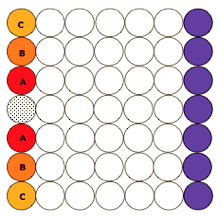
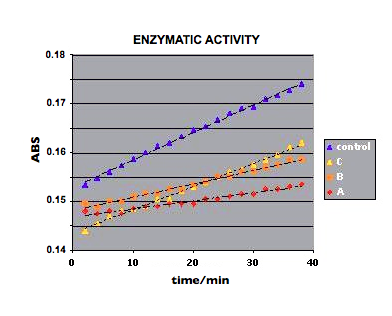
Figure 23.
Figure 23. shows the enzimatic activity curves with a slope variation
following the order C>B>A wich means an increasing inhibition of
the enzyme as the distance to the allicin well diminish. Moreover these
curves have a lower slope than those with sealed wells.
The close agreement between these results and those obtained with
bacterial cultures allows us to ascertain that there is an inhibition
effect produced by allicin vapors. This “distance effect“
reveals a powerful inhibition ability from allicin to enzymes with a
sulphydryl active center, and should be studied in detail by specific
techniques (e.g. gas chromatography/mass spectrometry).
![]()